AcademyPartners


Article
What is RSI, the Relative Strength Index
Updated 21 Oct 2025
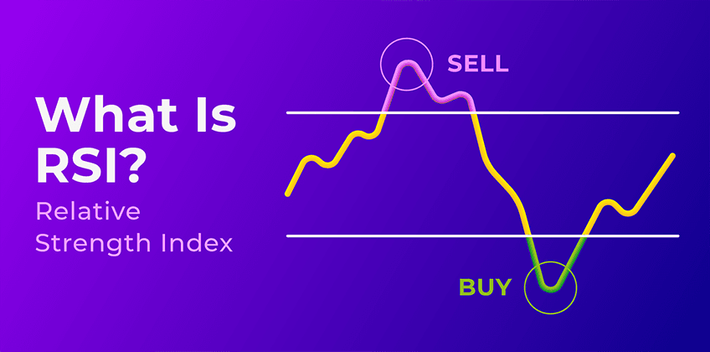
RSI, or Relative Strength Index, is a momentum oscillator used in trading to measure the speed and magnitude of recent price changes to identify overbought or oversold conditions in a security.
It is displayed as a line graph on a scale from 0 to 100, with readings above 70 often indicating an asset is overbought and below 30 suggesting it is oversold.
Key Takeaways (RSI Indicator)
RSI is a momentum indicator showing when assets are overbought or oversold.
It helps identify reversals, trend strength, and entry/exit points.
Best used in combination with tools like moving averages, Fibonacci levels, MACD, and trendlines.
Traders should always consider market context and apply risk management.
RSI works well across forex, stocks, and commodities, making it a versatile tool for all traders.
How RSI Indicator Works
The Relative Strength Index (RSI) is a widely used momentum oscillator that measures the speed and magnitude of price movements. It operates by comparing recent gains to recent losses over a specific time frame, typically 14 periods. This simple but powerful indicator helps traders identify overbought and oversold conditions, potential reversals, and trend confirmation signals.

Here’s how it works:
RSI Formula:
RSI = 100 - (100 / (1 + RS))
Where RS (Relative Strength) = Average Gain over N periods / Average Loss over N periods
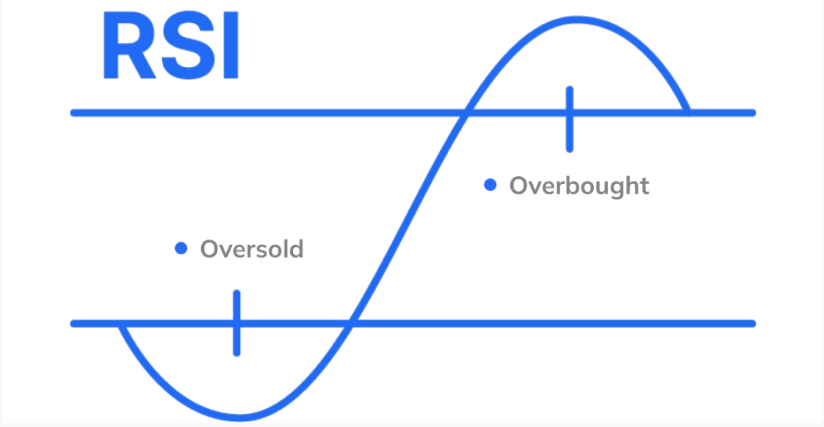
This calculation produces a value between 0 and 100:
Above 70: Indicates that the asset may be overbought and could be due for a pullback.
Below 30: Suggests the asset may be oversold, implying a potential upward correction.
Between 30–70: Neutral zone. Traders often wait for additional confirmation signals in this range.
Example: If a stock’s RSI moves above 70, it might be considered overbought, increasing the likelihood of a price decline. Conversely, if RSI drops below 30, it could be oversold and ready for a rebound.
RSI Indicator in Forex, Stocks, and Commodities
The RSI indicator is effective across multiple asset classes:
Forex Trading:
Forex trading markets experience constant price swings. RSI helps identify when currency pairs are overbought (above 70) or oversold (below 30).
Example: If EUR/USD RSI rises above 70, traders might prepare for a potential reversal or consolidation phase.
Stock Trading:
RSI helps spot trading stocks that are overextended or undervalued based on recent price action.
If a stock's RSI is consistently above 70, it may suggest overheating. Below 30 could indicate undervaluation and buying interest.
Commodity Trading:
Commodities like gold trading, trading brent crude oil, and silver trading follow strong cycles. RSI reveals when these cycles may shift.
Example: An RSI above 70 during a gold rally could indicate a good moment to take profits.
Confirming Trends with RSI Indicator
RSI is not only useful for timing entries and exits, but also for validating trend strength.
In Uptrends: RSI tends to stay above 50, reinforcing bullish sentiment.
In Downtrends: RSI often remains below 50, confirming bearish momentum.
Example: During a sustained EUR/USD rally, if RSI holds above 50, it supports the idea of maintaining long positions.
RSI Divergence: A Powerful Signal
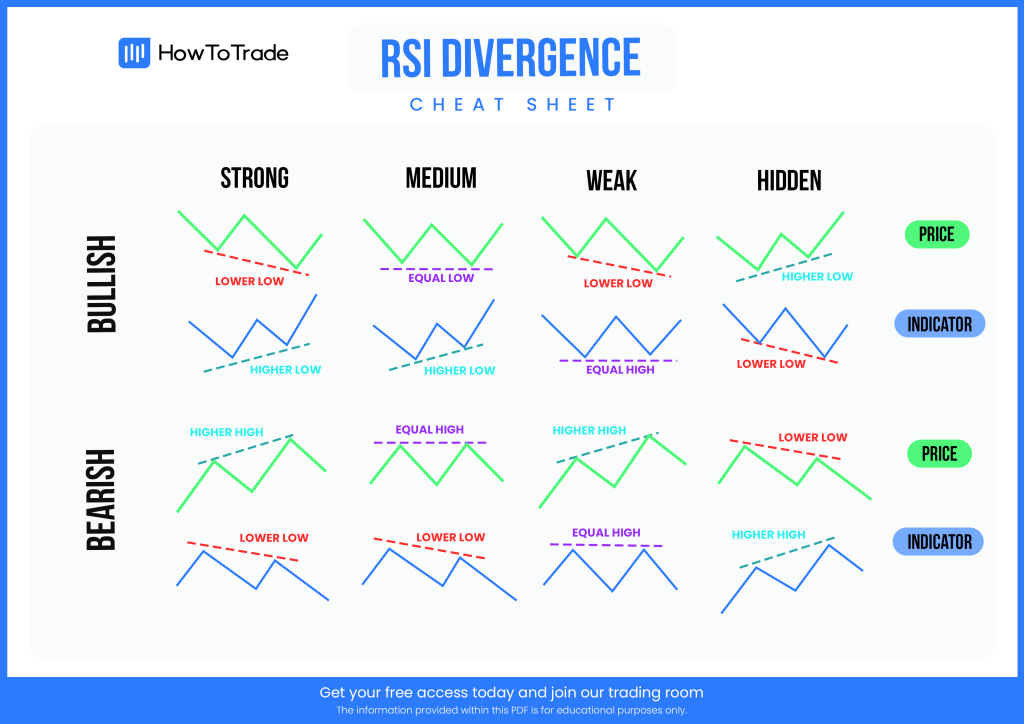
Divergences between price action and the RSI can indicate weakening trends or upcoming reversals.
- Bearish Divergence: Price makes higher highs, but RSI makes lower highs. This warns of weakening momentum and a potential sell-off.
Bullish Divergence: Price makes lower lows while RSI makes higher lows. This suggests bearish momentum may be fading, and a reversal could be near.
Example: If GBP/USD creates a new low but RSI does not, traders may look for a bullish reversal setup.
Combining RSI Indicator with Other Indicators
How to combine RSI Indicator with other Indicators?
RSI becomes even more powerful when combined with complementary tools.
RSI + Moving Averages: An RSI overbought signal near a 200-day moving average resistance level can strengthen the case for a short position.
RSI + Fibonacci Retracement: If RSI is oversold at a 61.8% fibonacci retracement level, it could present a high-probability buying zone.
RSI + Trendlines: Confirm RSI signals with bounces or breaks of well-defined trendlines.
RSI + Bollinger Bands: Identify volatility expansions or contractions in conjunction with RSI levels.
RSI + MACD: Use RSI to assess momentum strength, and MACD (Moving Average Convergence Divergence) for crossover confirmation.
Common RSI Indicator Mistakes to Avoid
Overreliance on RSI:
Traders who rely on RSI alone may fall into traps. RSI should be part of a broader strategy including trend analysis, support/resistance levels, and volume confirmation.
Ignoring Market Context:
In strong trending markets, RSI can stay in overbought or oversold zones for extended periods. Context is key—don’t blindly sell just because RSI crosses 70 in a bull trend.
Poor Risk Management:
RSI signals are not guarantees. Always use stop-losses and position sizing. Example: RSI overbought + short position = include stop above recent highs.
RSI Indicator in Different Markets: Forex, Stocks and Commodities
The RSI’s versatility makes it applicable to various markets beyond forex. Here’s how it can be used effectively in stock and commodity trading:
Stock Trading:
Use RSI to gauge exhaustion during earnings rallies or panic selling.
Divergences during earnings seasons can provide early reversal signals.
Commodity Trading:
- RSI helps navigate sharp commodity swings driven by supply shocks or geopolitical headlines.
Example: RSI divergence during an oil spike may indicate a speculative top
The Relative Strength Index (RSI) is an essential tool for traders. It offers a clear and straightforward way to assess market momentum and potential price reversals. Due to its simplicity and effectiveness in various markets, including forex, stocks, and commodities, it is particularly valuable for beginners.
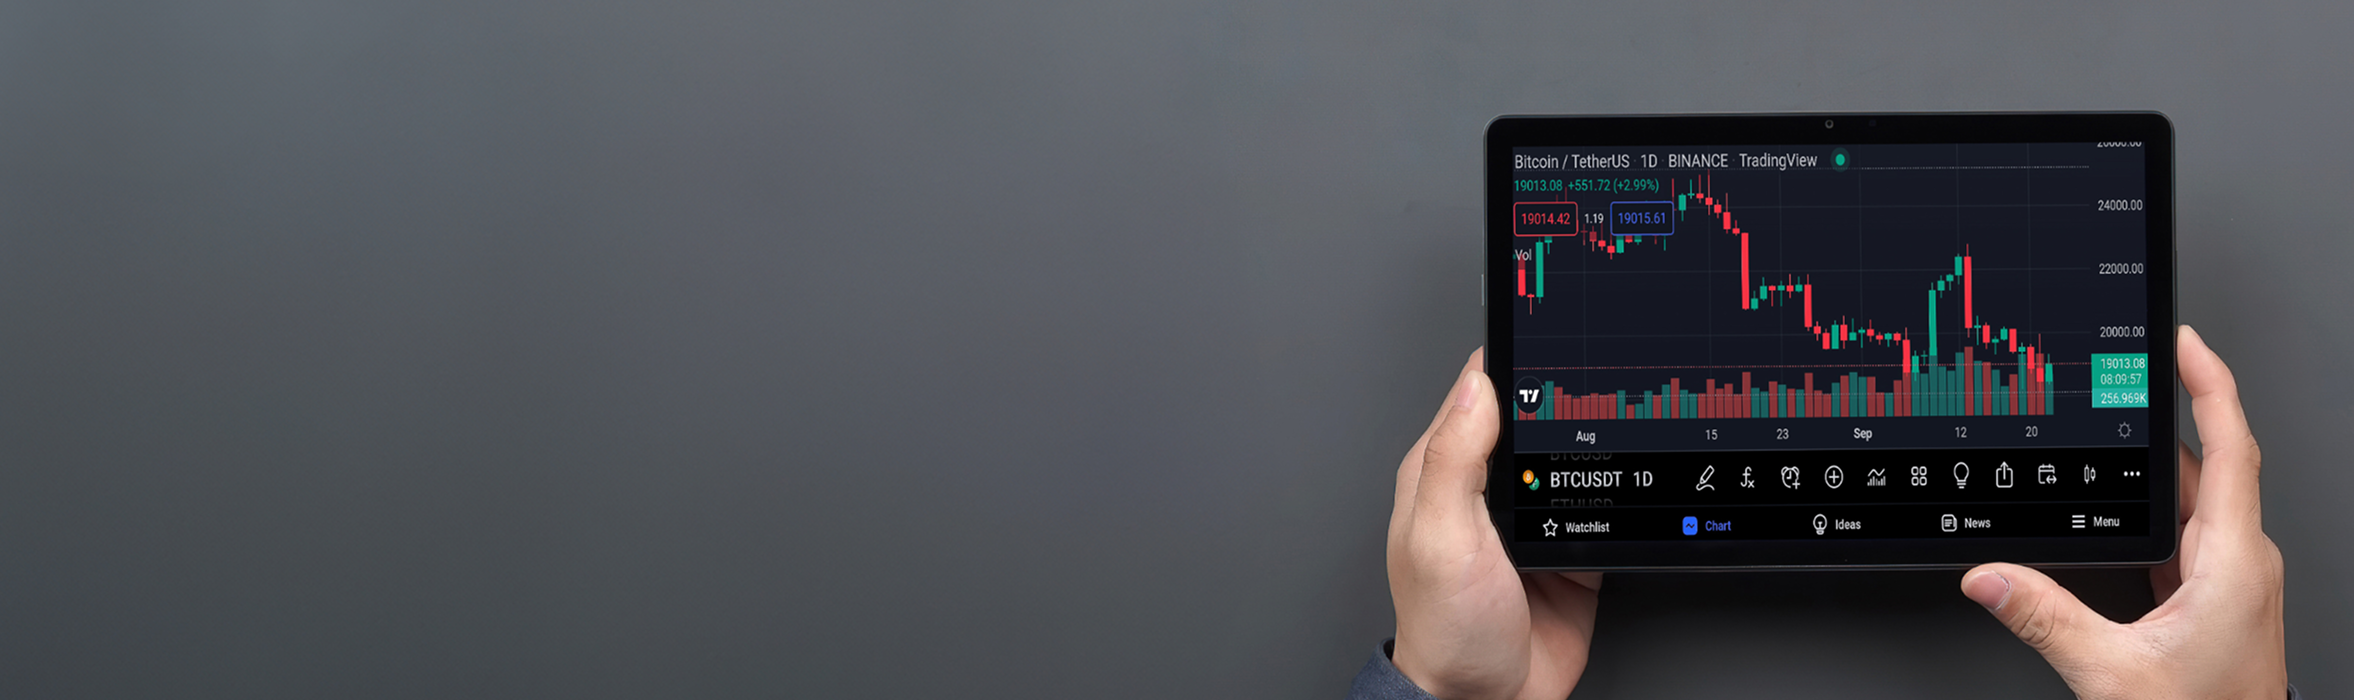
Applying RSI Indicator on TMGM’s Platform
Trading with TMGM, one of the leading global CFD providers, offers a range of advantages, especially for beginner traders looking to apply technical indicators like the Relative Strength Index (RSI). TMGM’s platform is designed to be user-friendly, providing a seamless experience whether you’re trading forex, stocks, or commodities.
Using RSI on TMGM’s Trading Platform:
Applying the RSI indicator on TMGM is simple and effective. Whether you're using the web or desktop version, RSI indicator can be set up in just a few clicks to support any complex trading strategy. Whether it is day trading strategies or swing trading strategies across forex, stocks, or commodities, RSI indicator is definitely one of the strongest indicators to master.
Here’s how TMGM enhances RSI-based trading:
Customize RSI Periods: Shorten the RSI timeframe for scalping strategies or extend it for swing trading—TMGM lets you tailor the settings to your style.
Overlay with Other Indicators: Combine RSI with moving averages, Bollinger Bands, or MACD to confirm trends using TMGM’s advanced charting tools.
Real-Time RSI Monitoring: React quickly to overbought or oversold signals thanks to TMGM’s low-latency infrastructure and fast order execution.
Learn as You Trade: TMGM offers tutorials, webinars, and articles to help you master RSI and integrate it into a full technical strategy.
Educational Resources:
New traders can access step-by-step tutorials, webinars, and live trading examples to learn how to interpret RSI readings and combine them with other technical tools effectively.
Optimized for Beginners
TMGM’s platform is designed to cater to traders at all levels, but it’s particularly advantageous for beginners. The platform’s ease of use and comprehensive educational resources make it an excellent choice for those new to trading. Leveraging RSI on TMGM, beginners can develop a solid foundation in technical analysis while benefiting from a supportive and efficient trading environment.
Ready to start trading with a platform that offers powerful tools like RSI and much more? Visit TMGM today to explore their platform and take your trading to the next level. Whether you’re just starting or looking to refine your strategy, TMGM provides the tools and support you need to succeed in the markets.
Trade Smarter Today


Frequently Asked Questions (FAQs)
What is RSI (Relative Strength Index) in trading?
+
How does RSI work in trading?
+
Is RSI better than MACD?
+
How do I use RSI indicator?
+
What is a good RSI to buy?
+

Join Over 1,000,000 clients on our award-winning trading platform
1
Apply for a Live
Account
Account
2
Fund Your
Account
Account
3
Start Trading
Instantly
Instantly
Open Account
Recommended for you
Ready to
Get Started!Get Started!
Get Started!Get Started!
Sign up and access the Global Markets in less than 3 minutes


The information provided on this website is of a general nature only and does not constitute personal financial advice. Before acting on any information on this website, you should consider the suitability of the information in relation to your objectives, financial situation and needs. Investing in CFDs and FX Margin Contracts carries significant risks and is not suitable for all investors. You may lose more than your initial deposit. You do not own, or have, any interest in the underlying asset. We recommend that you seek independent advice and ensure you fully understand the risks involved before trading. It is important that you read and consider the disclosure document before you acquire any product listed on the website. The information and advertisements offered on this website are not intended for use by any person in any country or jurisdiction where such use would be contrary to local laws and regulations. The Products and Services offered on this website are not intended for residents of the United States.
TMGM is authorized and regulated in various jurisdictions.
Trademax Australia Limited, trading as TMGM, is regulated by the Australian Securities and Investments Commission (ASIC), AFSL no. 436416 and is located at Level 28, One International Tower, 100 Barangaroo Avenue, 2000 Sydney, NSW Australia.
Email: support@tmgm.com.au
Trademax Global Limited, trading as TMGM, is authorized and regulated by the Vanuatu Financial Services Commission (VFSC), registration number 40356 and registered at 1276, Kumul Highway, Port Vila, Vanuatu, Republic of Vanuatu.
Email: support@tmgm.com
Trademax Global Markets (SE) Limited, trading as TMGM, is authorized and regulated by the Financial Services Authority (FSA) of Seychelles, with license number SD224. The company is registered at Office No 13, Providence Estate ABIS Centre, Mahe, Seychelles.
Email: support@tmgm.com
Trademax Global Markets (International) Pty Ltd, trading as TMGM, is authorized and regulated by the Financial Services Commission, Mauritius (FSC) with license no. GB22201012, and registered at 33, Edith Cavell Street C/o IQ EQ Fund Services (Mauritius) Ltd Port Louis, 11324 Mauritius.
Email: support@tmgm.com
Copyright © TMGM. All rights reserved